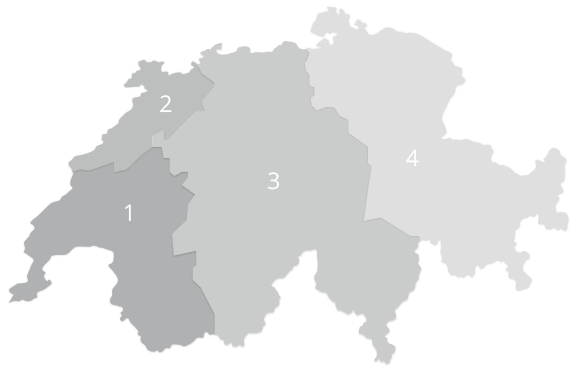
Indice du travail temporaire par trimestre 2024 selon les régions
| Code postal | T1 | T2 | T3 | T4 | janvier - décembre | |
|---|---|---|---|---|---|---|
| Région 1 | 1000-1999 | 2.6% | -1.0% | -3.1% | -6.2% | -2.1% |
| Région 2 | 2000-2999 | -13.3% | -21.8% | -25.2% | -28.6% | -22.3% |
| Région 3 | 3000-6999 | -17.5% | -18.0% | -21.3% | -20.8% | -19.4% |
| Région 4 | > 7000 | -2.5% | -6.9% | -7.8% | -10.6% | -7.2% |
| Ensemble de la Suisse | -6.7% | -9.6% | -11.9% | -13.5% | -10.6% |